The dashboard is green. The incident is real.
The model endpoint is available. P95 latency is inside the objective. Token consumption is stable. HTTP error rate has not moved. Yet users are correcting more answers, an agent is opening the wrong records, and a workflow that used to finish in two tool calls now needs six.
Nothing in the infrastructure view says the system is broken. The business process says otherwise.
This is the central problem of enterprise AI observability: a successful model invocation is not the same as a successful operation. Tokens and latency describe the mechanics of a call. They do not establish whether the system used the right evidence, selected the right action, complied with policy or completed the task it was introduced to perform.
Production AI needs an observability model that connects runtime behavior to business outcome. Without that connection, teams can monitor consumption while remaining blind to correctness.
What is enterprise AI observability?
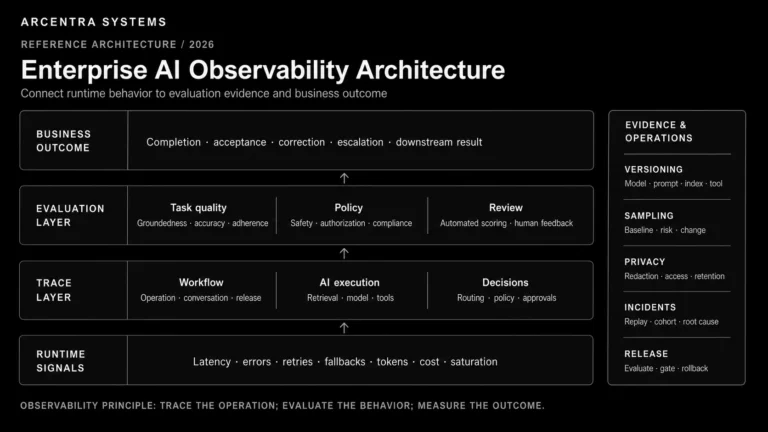
Enterprise AI observability is the ability to reconstruct, evaluate and explain the behavior of an AI-enabled business operation across applications, models, enterprise knowledge, tools and policy controls.
It combines four kinds of evidence:
- Runtime signals show whether the components were available and how much time and capacity they consumed.
- Execution traces show which retrieval, model and tool operations produced the result.
- Evaluation signals estimate whether the result was correct, grounded, safe and compliant with the task contract.
- Outcome signals show whether the user or business process actually achieved the intended result.
The four layers answer different questions. A metric can tell an operator that tool-call failures increased. A trace can identify the failing tool and the arguments passed to it. An evaluation can determine whether the agent selected that tool appropriately. An outcome signal can show whether the failure caused abandonment, manual correction or financial loss.
Calling all four “monitoring” hides the differences in how they are collected, stored and acted upon.
Why traditional observability stops too early
Classical service observability remains necessary. An AI application still has queues, databases, network calls, memory pressure, saturation and downstream dependencies. Those systems still require metrics, logs and distributed traces.
The difference is that a technically valid response can be operationally wrong.
A conventional service usually has a relatively explicit contract: return the requested record, persist the transaction or reject invalid input. An AI component often has a probabilistic contract expressed through prompts, retrieved context, tool definitions and examples. The endpoint may return 200 while violating the useful intent of that contract.
This creates three failure classes that infrastructure telemetry alone cannot resolve:
- Semantic failure: the response is fluent but unsupported, incomplete or irrelevant.
- Decision failure: the model chooses an inappropriate tool, route or next action.
- Outcome failure: the individual steps appear valid, but the business task is not completed.
Microsoft’s current guidance makes the same architectural distinction: AI observability extends logs, metrics and traces with evaluation and governance because probabilistic systems cannot be understood through operational telemetry alone. Google documents continuous evaluation of production output as a separate monitoring mechanism, while AWS exposes end-to-end prompt tracing alongside operational dashboards. The direction is consistent: execution data and quality evidence have to meet.
The unit of diagnosis is the operation, not the model call
A model call is often only one step in a larger transaction.
A support agent may classify a request, retrieve account policy, call a customer system, ask a second model to draft a response and then wait for approval. A document workflow may run OCR, retrieval, extraction, validation and exception handling. Measuring each model call independently produces detailed fragments without preserving the operation they belong to.
The top-level trace should represent the business operation: resolve_support_case, review_credit_exception or extract_supplier_invoice. Retrieval, model calls, tool executions, policy checks and human approvals should appear as child spans.
That hierarchy allows operators to answer questions that model-centric dashboards cannot:
- Which step consumed most of the end-to-end latency?
- Did the model retry because a provider failed or because a tool returned unusable data?
- Which model, prompt, knowledge index and tool version produced the decision?
- Did a fallback preserve the technical response while changing the result?
- How much did the completed business operation cost?
OpenTelemetry’s generative-AI conventions provide a useful common vocabulary for model operations, requested and returned models, token usage, agents and tools. They should be treated as the AI portion of a distributed trace—not as a replacement for the application, database, messaging and infrastructure spans around it.
Measure five layers, not one dashboard
1. Runtime health
This is the familiar foundation: request rate, errors, throttling, queue depth, saturation and latency distributions. For model workloads, separate time to first token from total generation time. A streaming response can feel responsive while still occupying capacity for a long period.
Measure retries and fallbacks as first-class events. A stable success rate can conceal a primary backend that is failing continuously behind automatic recovery. The user sees an answer; the platform sees rising cost, longer paths and reduced redundancy.
Do not collapse latency into a single model number. Track the full operation and its components: retrieval, policy, gateway, provider, tool and application processing. Otherwise every slow workflow becomes “the LLM is slow,” even when the model is not the bottleneck.
2. Consumption and economic efficiency
Token counts are useful, but they are inputs to cost attribution—not the economic outcome.
At minimum, attribute consumption by application, tenant, workflow, environment, model and route. Then derive measures that reflect useful work:
- cost per completed operation;
- cost per accepted answer;
- tokens consumed by failed or abandoned operations;
- incremental cost created by retries and fallbacks;
- tool and retrieval cost around the model call;
- capacity consumed by requests later rejected by policy or validation.
A cheaper model is not cheaper if it creates more retries, more human corrections or more downstream exceptions. The relevant denominator is successful work.
3. Execution integrity
Execution integrity asks whether the system followed an allowed and coherent path.
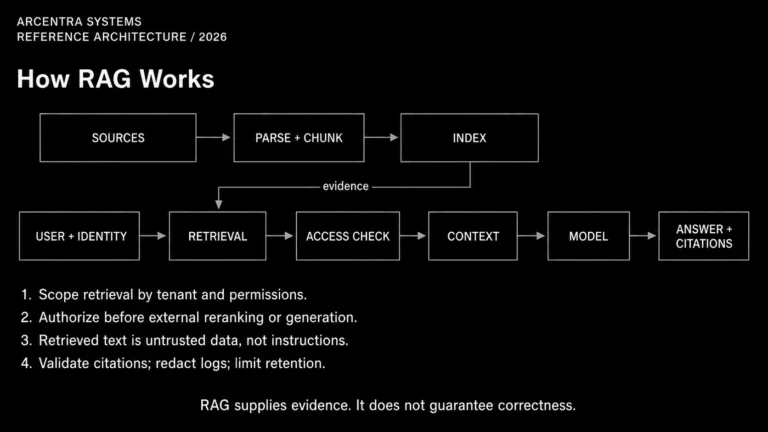
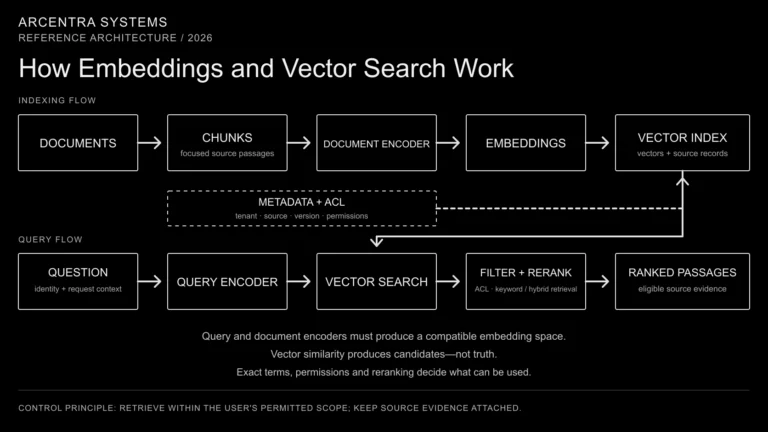
For retrieval, record the index and version, query, document identifiers, access decision, result count and retrieval latency. Avoid assuming that retrieved content was useful merely because documents were returned. Record whether the selected evidence was cited or used by the response.
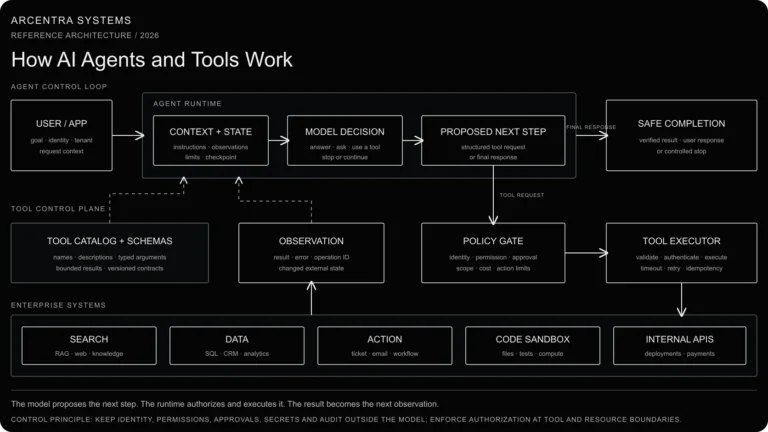
For tools, record the registered tool identity and version, authorization scope, sanitized arguments, result status, duration and side-effect identifier. The trace must distinguish a model proposing an action from the platform authorizing and executing it.
For agents, capture loop count, tool sequence, termination reason, handoff and approval events. A rising step count is often an early signal of degraded planning or changed tool behavior even when the final completion rate has not yet fallen.
4. Output quality and policy
Quality is not one universal score. It is a set of claims tied to a task.
A retrieval answer may require groundedness and citation correctness. Extraction requires field accuracy and schema validity. An agent may require task completion, correct tool choice and adherence to approval boundaries. Customer communication may add tone and policy requirements.
Each production route should therefore have a small evaluation contract:
- the dimensions that matter;
- the scorer or review method used for each dimension;
- the population and sampling rule;
- the threshold and confidence needed for action;
- the owner of failed cases.
Automated evaluators are measurement instruments, not ground truth. An LLM judge can change behavior when its own model or prompt changes. Version the evaluator, calibrate it against human-reviewed examples and retain enough information to reproduce the score.
Production evaluation should combine cheap deterministic checks on broad traffic with deeper semantic evaluation on a sample. Schema validation, citation existence, denied-tool usage and policy outcomes can be checked synchronously. Groundedness, task adherence and conversation quality are usually better evaluated asynchronously.
5. Business outcome
This is the layer most AI observability implementations omit.
Useful outcome signals include acceptance without editing, successful task completion, escalation, rework, user correction, process cycle time, exception rate and downstream reversal. The right measures depend on the workflow, but they must come from the system where the business result is recorded—not from the model response.
Feedback buttons are weak evidence on their own. They are sparse, biased and often measure user mood rather than task correctness. Join explicit feedback with implicit behavior and authoritative process outcomes.
The join requires a stable operation identifier propagated from the user interaction through the AI trace and into the downstream transaction. Without that identifier, quality dashboards and business dashboards describe the same system but cannot explain each other.
What an AI incident record must preserve
When an AI incident occurs, the useful question is rarely “what did the model say?” The investigation needs to reconstruct the conditions that produced the behavior.
An incident-ready record should identify:
- application, tenant, user or agent identity and delegated authority;
- workflow, trace and conversation identifiers;
- model alias, resolved provider model and routing reason;
- prompt template and configuration version;
- knowledge index, retrieval query and source identifiers;
- tool definitions, authorization decisions, calls and side effects;
- policy and guardrail decisions;
- evaluation policy, scorer version and resulting scores;
- human approval, correction or override events;
- the final business outcome.
This does not mean storing every prompt and response forever. Content can contain personal data, secrets, legal material and business records. OpenTelemetry explicitly warns that message and tool-call attributes may contain sensitive information.
Retention must be designed by data class. Metadata can often be retained longer than content. Sensitive routes may keep hashes, source identifiers and decision metadata while suppressing raw bodies. Debug sampling should be controlled, access-audited and revocable. Observability is not an exemption from data governance.
Sampling must follow risk, not convenience
Recording every detail for every operation is usually too expensive and too risky. Recording only failures is also insufficient: semantic failures often look technically successful.
A mature sampling policy uses several paths:
- Baseline sampling provides a representative view of normal traffic.
- Error sampling retains infrastructure, tool and policy failures at a higher rate.
- Risk sampling increases coverage for sensitive workflows, privileged tools and high-value transactions.
- Evaluation-triggered sampling retains traces when online checks or user behavior indicate a possible quality problem.
- Change sampling increases coverage after a model, prompt, index, tool or policy release.
Head sampling alone cannot see the final outcome. Tail-based decisions are required when retention depends on a late failure, high cost, fallback, poor evaluation score or user correction.
Alert on controllable conditions
A dashboard can contain dozens of AI metrics. Very few should wake an operator.
Paging alerts should identify a condition that is urgent, actionable and tied to a service objective: a sharp drop in completion rate, unauthorized tool execution, a quality threshold breach across sufficient volume, exhausted model capacity or a fallback path losing its redundancy.
Individual low evaluation scores rarely meet that standard. They belong in a review queue unless they indicate a severe policy or safety event. Noisy semantic alerts train the organization to ignore the exact evidence the observability system was built to provide.
Use different response paths for different evidence:
- page operations for immediate availability and control failures;
- open engineering investigations for sustained quality regression;
- route individual cases to domain review;
- block releases when an evaluation suite falls below its contract;
- trigger security response for prohibited access or tool behavior.
Version everything that can change the answer
A model name is not enough to reproduce an AI result.
The answer can change when the system prompt, model revision, temperature, routing policy, retrieval index, chunking strategy, tool schema, knowledge source, safety policy or evaluator changes. These versions belong in the trace and in the release record.
This is where observability joins delivery. A release should be queryable as a cohort of production operations. Teams should be able to compare the previous and current versions across runtime, cost, evaluation and outcome signals, then roll back the component that caused the regression.
The broader operating model is described in our guide to production AI operations and reliability. The same principle applies here: AI behavior must be managed through versioned releases and evidence, not through dashboard interpretation after the fact.
A practical implementation sequence
Stage 1: Preserve the operation
Introduce a stable operation identifier and propagate it through application, gateway, retrieval, model and tool calls. Record model resolution, token usage, latency, errors, retries and cost attribution. Do not begin with prompt capture everywhere.
Stage 2: Make the trace reproducible
Add versions for prompts, routes, knowledge indexes, policies and tools. Capture authorization and side-effect identifiers. Establish data classification, redaction and retention rules before expanding content collection.
Stage 3: Attach evaluation
Define task-specific evaluation contracts. Run deterministic checks broadly and semantic evaluators on sampled traces. Calibrate automated scores against domain review and use the same evaluation definitions before and after release.
Stage 4: Join business outcomes
Connect traces to completion, correction, escalation and downstream transaction results. Replace cost-per-token dashboards with cost and quality per successful operation.
Stage 5: Close the operating loop
Use trace cohorts to build regression datasets. Gate releases on the resulting evaluations. Increase sampling around change, and make rollback decisions from correlated evidence rather than isolated metrics.
This sequence also depends on the shared controls described in our enterprise AI platform architecture. Identity, routing, telemetry and release policy become difficult to enforce when every application integrates models independently.
Observability is the evidence layer of the AI platform
Tokens and latency matter. They tell the platform whether resources were consumed and how long the request took. They do not tell the enterprise whether the system made a defensible decision or completed useful work.
That requires a chain of evidence:
runtime signals explain the components; traces reconstruct the operation; evaluations test the behavior; outcomes establish whether the operation mattered.
Enterprise AI observability is the architecture that keeps those layers connected. When it works, an operator can move from a declining business outcome to the exact release, route, retrieval result, model call or tool action that caused it. When it does not, the organization is left with green infrastructure dashboards and unexplained production failures.
Sources and further reading
- OpenTelemetry: Inside the LLM Call—GenAI Observability with OpenTelemetry
- OpenTelemetry: Generative AI semantic attributes
- Microsoft: Observability for generative AI and agentic AI systems
- Google Cloud: Deploy and operate generative AI applications
- AWS: Generative AI observability
- NIST AI 600-1: Generative Artificial Intelligence Profile